Compensation Services for the Decision Maker
Welcome
Scattergrams

The Scattergram visually displays the wage/salary practice for a fictitious Company XYZ. The X-axis (horizontal) displays the size of the job as determined by the grade. The Y-axis (vertical) displays the wage/salary dollars.
For each position matched by Company XYZ, a “+” has been plotted at the coordinates of that position's pay versus that position‘s job content. As you will notice moving along the graph from left to right, pay tends to increase with increased job content; i.e. the bigger the job - the more the pay.
The line placed on the scattergram is a statistically computed least-squares-regression line which represents the overall pay trend. This regression line is sometimes referred to as the “line of central tendency” or the “line of best fit.”
The above scattergram shows the Hourly positions matched by Company XYZ in the Survey. Company XYZ also received a second Scattergram for their Non-Exempt positions matched in the survey and a third Scattergram for their Exempt positions matched in the survey.
Below is the table with the data used for the Scattergram along with important definitions of terms used in the table.
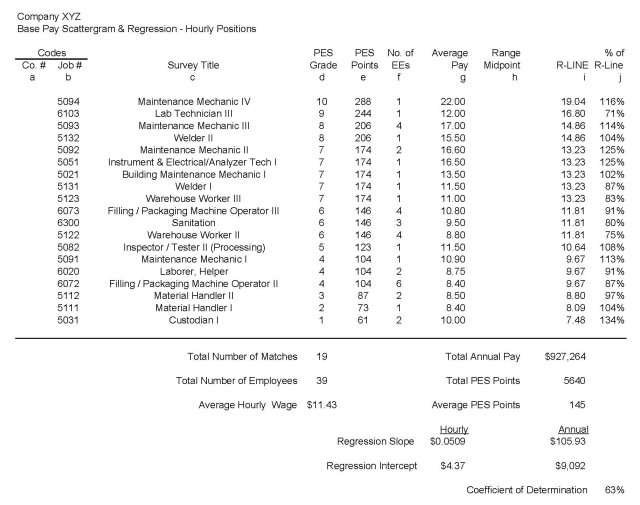
A few important compensation terms:
PES Grade: The Quorum Group assigned grade for the position based upon the job as designed and described for survey purposes. The PES GRADE ranges from 1 (lowest) to 10 (highest) for Hourly positions.
PES Points: The Quorum Group assigned points based upon the PES GRADE and used for a graphical representation of the pay practice.
No. of EEs: The number of employees (incumbents) reported by the organization for each position matched.
Average Pay: The numerical average of the actual wage/salary being paid to the number of employees reported for each position matched.
R-LINE: The value of the statistically computed least-squares-regression line at the appropriate PES POINTS. This line represent the overall pay trend and is sometimes referred to as the “line of central tendency” or the “line of best fit”. The line value is computed using the formula Y = mX + b where: X is the PES Points, m is the Regression Line Slope, b is the Regression Line Intercept and Y is the resulting value of the Regression Line.
% of R- LINE: The ratio of the AVERAGE PAY to the REGRESS LINE. A percent greater than 100% means the position is paid “above” the line, a percent less than 100% means the position is paid “below” the line.
Regression Slope: The rate at which Pay (Y) increase with increased Job Content (X). Calculated from two data points by the “change in Y” divided by the “change in X”. The value of “m” in the linear equation.
Regression Intercept: The value of Pay (Y) computed when Job Content (X) is zero; Sometimes referred to as the “warm body constant”. The value of “b” in the linear equation.
Coefficient of Determination: The portion of the Pay (Y, dependent variable) which is directly related to the value of Job Content (X, independent variable). The remaining portion is due to other factors.